The ProPitch System, a five star rating system
The three test categories
-

Playing Quality
Shock absorption (%)
Measured using an Artificial Athlete this test measures the ability of the sports surface to absorb impact forces when subjected to loadings designed to replicate players running on the surface. The result is expressed as the percentage reduction in impact severity when compared to a similar impact on concrete. Surfaces giving results of below 40% will generally be considered to be firm, whilst surfaces giving results over 65% will be considered to be soft and possibly tiring.
Deformation (mm)
Also measured with an Artificial Athlete this test measures the degree to which the surface deforms when subjected to loadings designed to replicate players running on the surface. The result is expressed in millimeters. Surfaces giving higher results (in excess of 10mm) are likely to be considered unstable be players whilst surfaces with very low values might be considered to be firm and unyielding.
Energy Restitution
Also measured using an Artificial Athlete. The 'springiness' of a sports surface affects to some degree the performance of a player or athlete. The softer the track, the more is the deformation in the surface produced by the athlete's foot and hence loss of energy due to visco-elastic or friction effects.
In terms of energy dissipation within the surface it is about 2 - 4 % of the energy (vertical) of the athlete's centre of mass (or a 20 - 40 % energy loss in the surface).
Ball Rebound (cm)
A measure of how high a football bounces when dropped vertically onto the sports surface. The ball is dropped from two meters and the height of rebound electronically measured. Although footballs do not often drop vertically during a game the test is a simple and reliable means of ensuring acceptable ball rebounds from a surface.
Ball Roll (m)
A measure of a surface's pace or speed measured by determining the resistance the surface offers to a rolling ball. Results are expressed in terms of either the distance a ball rolls after being released from an inclined plane or the rate it decelerates over a defined distance.
Traction
Rotational resistance – a measure of the resistance to turning experienced by a studded test plate load in a simulation of a player's body weight. Surfaces proving low values may be considered slippery and be difficult to turn on. High values may result in excessive foot grip.
Evenness (mm)
An assessment using a 3m long straight edge is used to measure how smooth the total playing area is. Excessive undulations may distort the way a ball runs across the playing surface, causing players to stumble or allow rainwater to collect in low spots.
-

Construction
Hardness
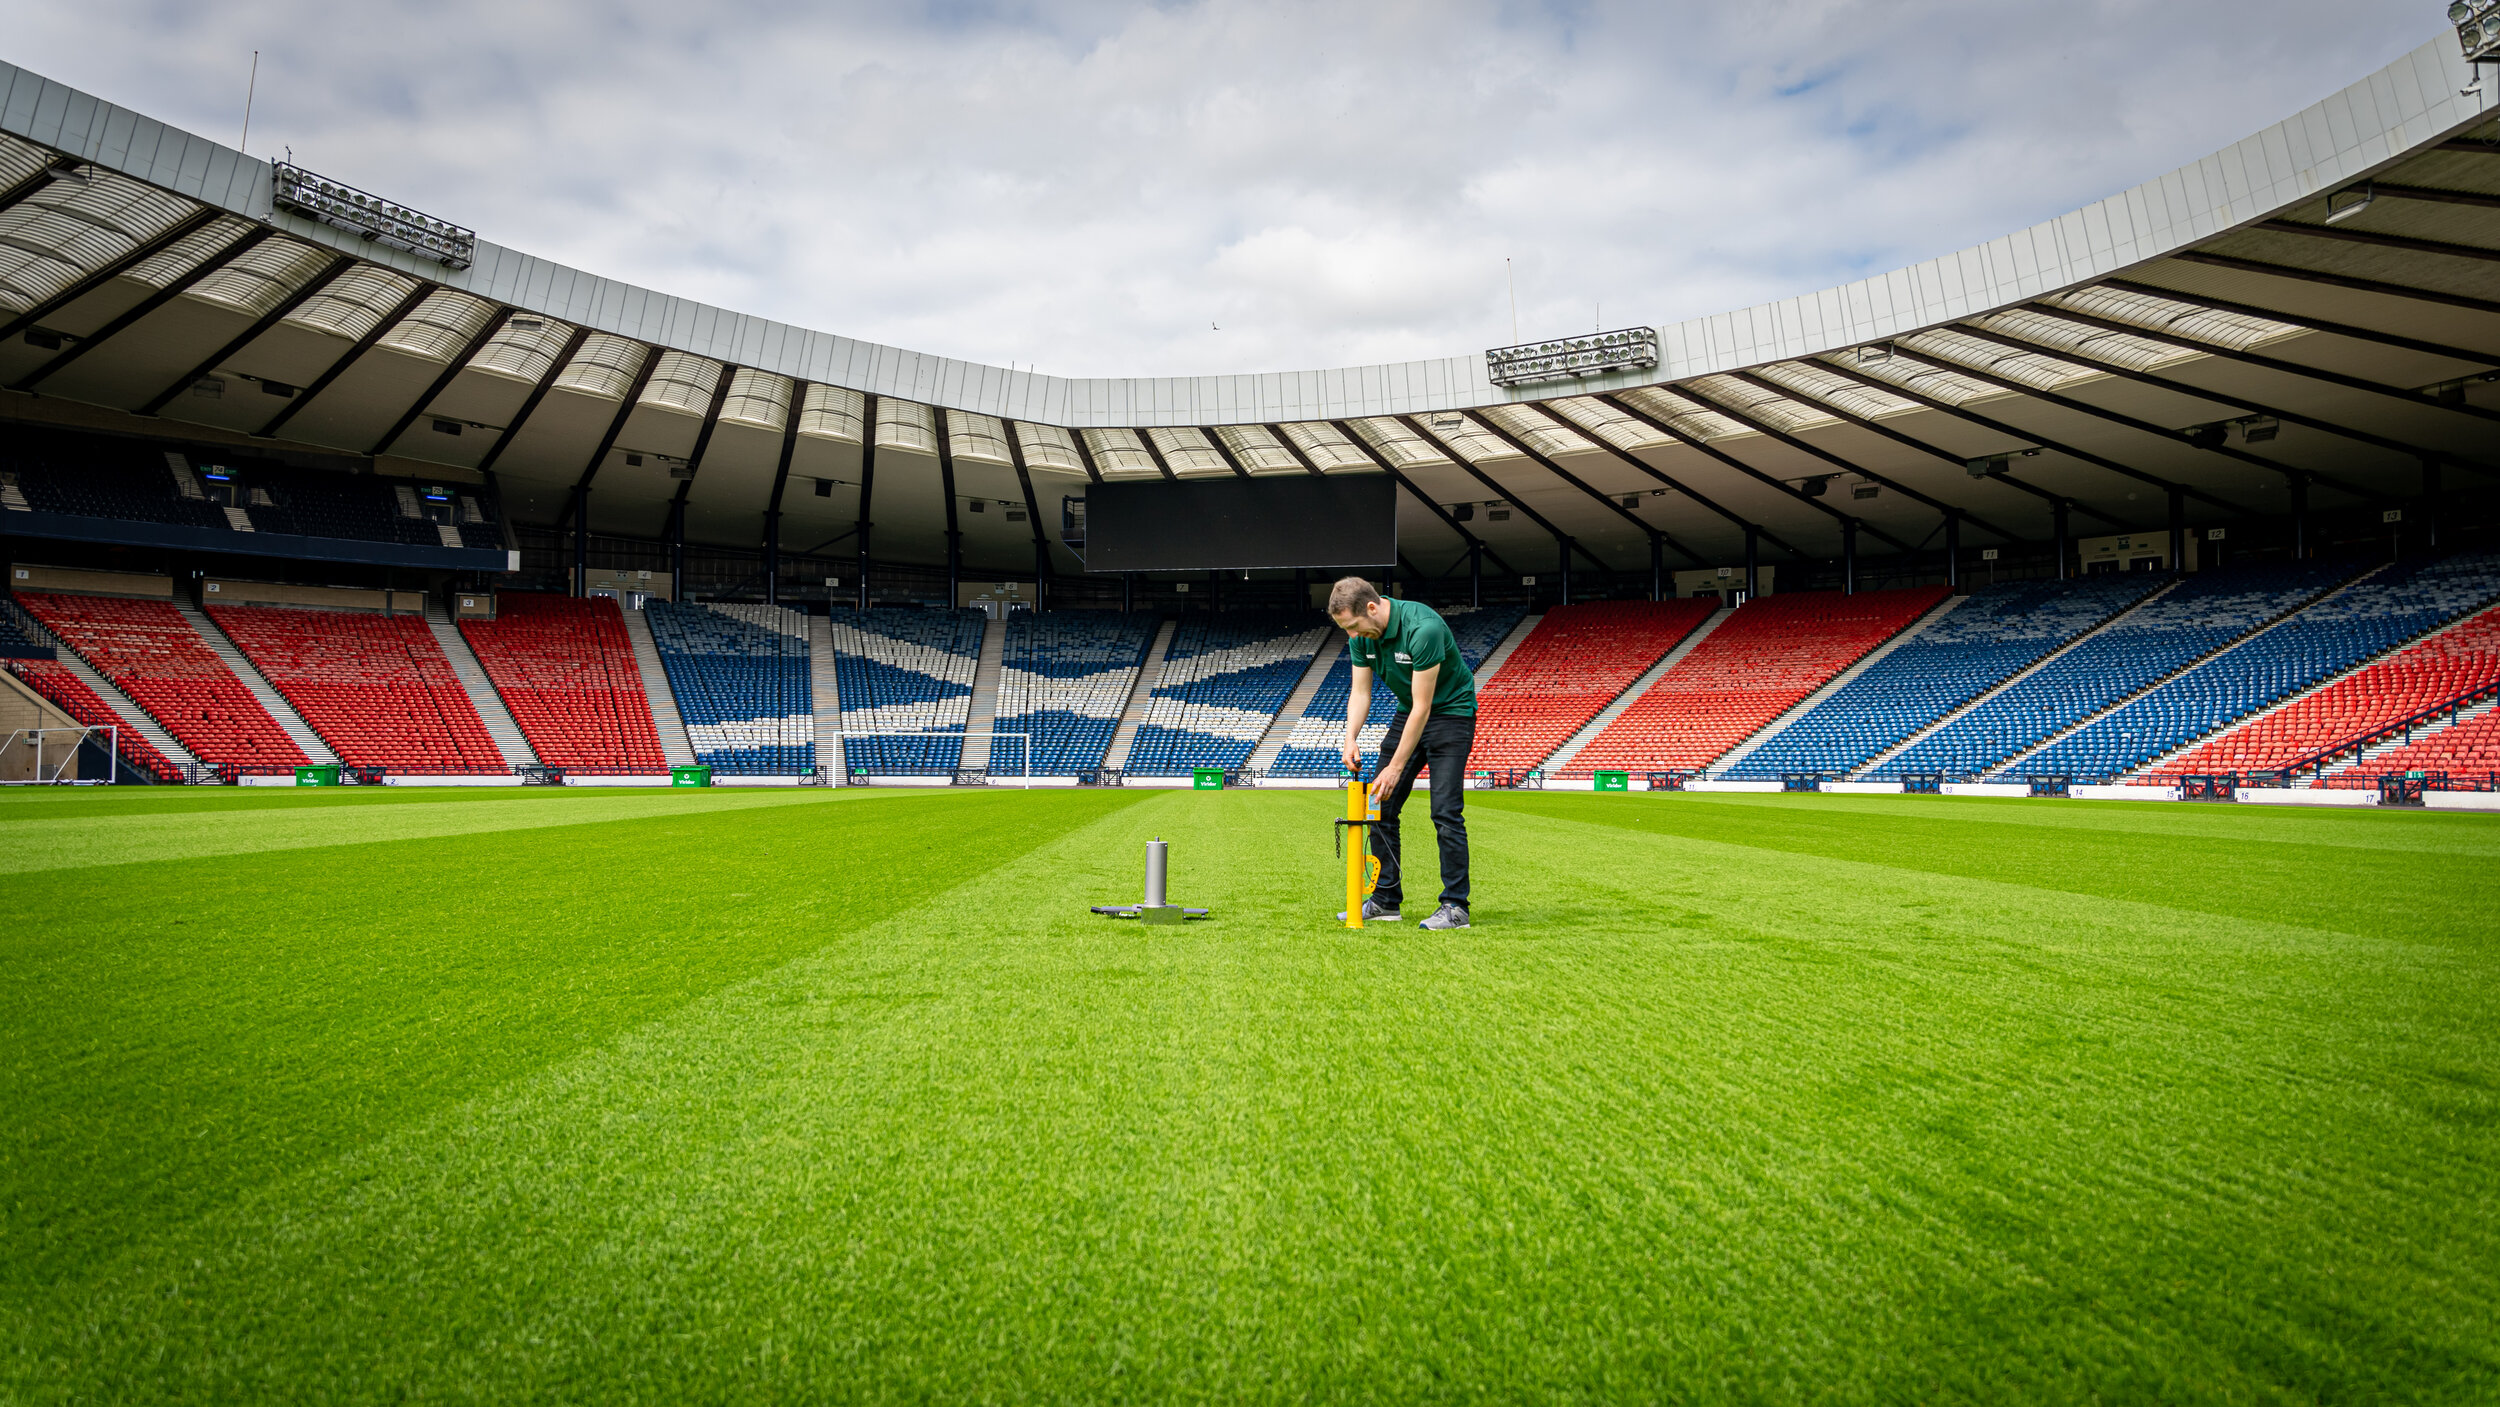
The surface hardness is determined by using a 'Clegg Hammer'. The Clegg Impact Soil Tester (commonly referred to as a Clegg hammer) is a sophisticated piece of equipment used for measuring and controlling soil strength and consolidation levels during pitch maintenance. It is also used to confirm uniform compaction over wide areas of ground, identifying poorly compacted areas and ineffective rolling of materials. The condition and hardness of a pitch will be influenced by many factors. A pitch with little or no effective maintenance will become compacted, resulting in poor sward composition and poor drainage.
Infiltration Rate
A measure of how quickly water standing on the playing surface is able to percolate way. The test is measured using a double ring infiltometer and the result is expressed in units of millimeter per hour.
-

Herbage (Grass Quality)
Total ground cover (%)
Expressed as a percentage of cover of grass over the entire pitch surface.
Weed Grasses (%)
Expressed as a percentage (maximum allowed 25%), any over-seeded or none-desired species of grasses that are found growing and competing with the desired grass. (This includes over-seed grasses that have been allowed to grow outside of the dormant period of the desired grass).
Sward Height (mm)
To establish if the correct height of cut is being maintained on the pitch according to the season and the conditions prevailing, a prism device is used to measure the cutting units while on the pitch.
Root Depth (mm)
A physical measurement is made by removing a small section of the pitch (the width and depth of a spade) and the extent of the growth of the root system is then measured by using a ruler.
Thatch Depth (mm)
Similarly thatch and procumbent growth in measured by a ruler to determine if there is too much thatch build up and identify any problems that may be occurring.
Appearance (%)
This test measures the uniform texture of the grass sward over the entire surface area of the pitch. It is measured as a percentage.
Sward Colour
Colour charts are used over the entire area of the pitch and look to see if there are any areas were the colour of the grass sward is uneven, i.e. large patches of yellowing grass or brown or black patches due to uneven fertilizer application during maintenance.
Diseases
A visual assessment is completed for the pitch surface, if signs of disease are found, a sample is taken and sent to a certified laboratory for full analyses.
Insect/Pests
A visual assessment is completed for the pitch surface, if signs of physical damage or if insects are present in large numbers, a soil sample will be taken and sent for laboratory analyses. In sub and tropical regions it may be necessary to make a live count of the insect problem to determine if there is a likelihood of damage to the pitch. A 1x1 meter grid is placed over an area of infestation and a live count is then made.
